


A platform is never really finished. Once it is live, the real work shifts to monitoring, reliability, cost control, change management, and making small improvements that keep it healthy.
Operating a cloud platform well means monitoring the right signals — Google's SRE book names four "golden signals" (latency, traffic, errors, saturation) as the minimum worth tracking for any user-facing system — and using an error budget to make the reliability-versus-feature-velocity trade-off an explicit, shared number rather than an ongoing political argument between product and operations teams. Alert quality matters as much as the monitoring itself: Google's own SRE Workbook shows that a naive "alert when the error rate exceeds the SLO" rule creates near-constant noise, which is why multiwindow burn-rate alerting has become the recommended approach. On Azure, this maps most directly to Azure Monitor and Application Insights; the same principles apply on AWS CloudWatch and Google Cloud Observability.
Key Takeaways
- If you can only track four things, Google's SRE book specifies which four: latency, traffic, errors, and saturation — chosen because together they give comprehensive coverage of a user-facing system's health (Google SRE Book).
- An error budget turns reliability into a number, not a negotiation. Once a service level objective is set, the allowable failure rate becomes an explicit budget; teams can ship faster while budget remains, and slow down automatically as it depletes (Google SRE Book — "Embracing Risk").
- A simple threshold alert on an SLO is worse than it looks. Google's own SRE Workbook shows that alerting whenever the error rate crosses the SLO threshold can trigger dozens of alerts a day while consuming a tiny fraction of the actual error budget (Google SRE Workbook — "Alerting on SLOs").
- Saturation is the signal most teams under-monitor, even though systems commonly degrade in performance well before hitting 100% utilization on their most constrained resource.
- Errors aren't just HTTP 500s. Google's own definition explicitly includes implicit failures — a "successful" response carrying the wrong content — and failures by policy, a broader definition than many teams' alerting actually covers.
- The tooling differs by cloud, the principles don't. Azure Monitor and Application Insights, Amazon CloudWatch, and Google Cloud Observability all implement metrics, logs, traces, and threshold/anomaly alerting — the four-signals and error-budget model applies regardless of which one a team standardises on.
- A well-run platform gives the organisation confidence to change things. Without operational discipline, even a well-architected platform becomes something people are afraid to touch, which slows everything down regardless of how sound the underlying design was.
What to Monitor: The Four Golden Signals
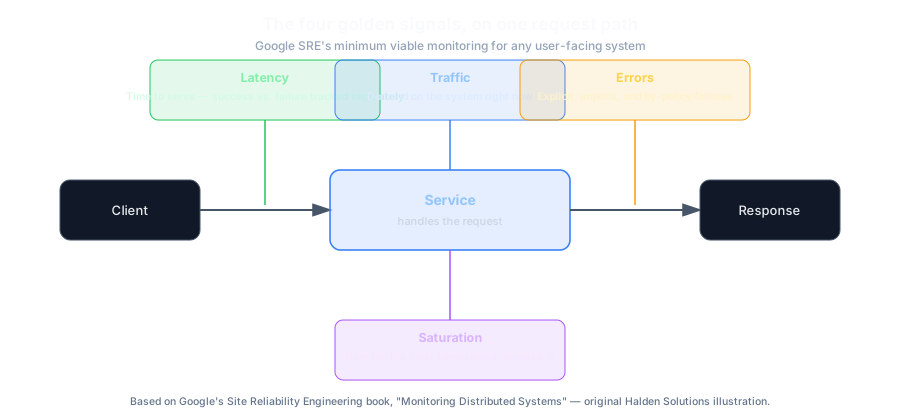
Google's Site Reliability Engineering book identifies four signals as the priority for monitoring any user-facing system, on the basis that if you can only measure a small number of things, these four give the most complete picture of health (Google SRE Book — "Monitoring Distributed Systems"):
| Signal | What it measures |
|---|---|
| Latency | Time to service a request — tracked separately for successful vs. failed requests, since a fast failure can mask a real problem if averaged in with successes |
| Traffic | Demand on the system — requests per second, I/O rate, or transactions per second, depending on the system type |
| Errors | Rate of failed requests — explicit (HTTP 500s), implicit (a 200 response with wrong content), or failures by policy |
| Saturation | How full the system's most constrained resource is — many systems degrade well before reaching 100% utilization |
The implicit-error category is worth calling out specifically, since it's the one most alerting setups miss: a request that returns HTTP 200 but with wrong or corrupted content will not trip a naive "error rate" alert based on status codes alone.
Error Budgets: Making Reliability a Shared Number
Google's SRE approach defines an error budget as the inverse of a service level objective: if an SLO requires 99.99% success over a quarter, the error budget is the remaining 0.01% of allowable failure for that period (Google SRE Book — "Embracing Risk"). This reframes what is otherwise a recurring, subjective argument — product teams wanting to ship faster, operations teams wanting more caution — into an objective, shared constraint: as long as the SLO is being met, releases continue at normal pace; if SLO violations consume the budget, releases slow down or pause until reliability recovers.
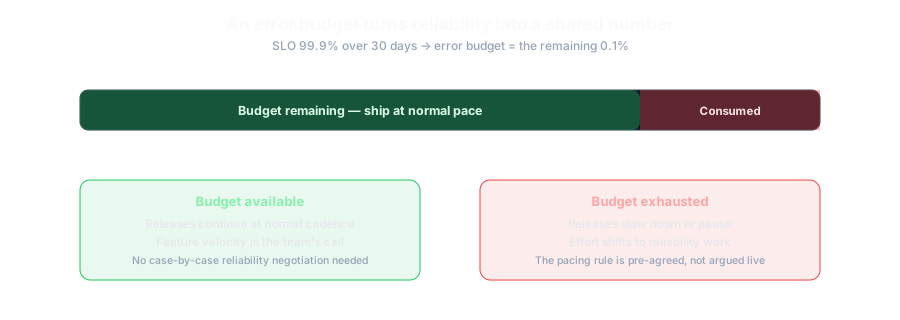
The effect is that engineering teams naturally self-regulate their own risk-taking based on remaining budget, rather than needing case-by-case reliability rulings from an operations team.
Why a simple SLO-threshold alert doesn't work
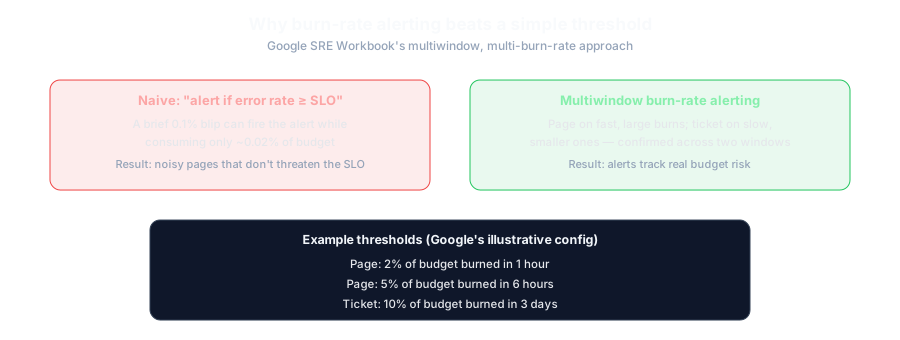
Once a team has an error budget, the obvious next step — alert whenever the current error rate crosses the SLO — turns out to be a poor rule in practice. Google's SRE Workbook walks through this directly: a brief 0.1% error-rate blip lasting ten minutes can trigger that alert while consuming only around 0.02% of a monthly error budget, which in a busy system can mean dozens of pages a day for events that never seriously threatened the SLO (Google SRE Workbook — "Alerting on SLOs"). The opposite failure mode is just as real: a fixed alerting duration can let a slow, chronic degradation consume a large share of the budget without ever tripping the alert.
Google's recommended fix is multiwindow, multi-burn-rate alerting: page on a fast burn confirmed across a short window (for example, 2% of budget consumed in one hour), page on a slower but still significant burn across a longer window (5% in six hours), and file a lower-urgency ticket for a slow burn over days (10% in three days) (Google SRE Workbook — "Alerting on SLOs"). The short window confirms the problem is still active before paging anyone, which is what keeps this approach from reintroducing the same noise problem it's meant to solve.
Implementing This on Azure, AWS, and Google Cloud
The four-signals-plus-error-budget model is provider-agnostic, but the plumbing that captures the signals differs by cloud. For teams standardising on Microsoft's platform, Azure Monitor is the native starting point: Microsoft describes it as a unified observability service collecting metrics, logs, and traces across Azure resources, virtual machines, Kubernetes clusters, and hybrid environments, queried through Log Analytics (KQL) or Azure Monitor workspaces (PromQL), with Application Insights providing OpenTelemetry-based application performance monitoring and dynamic-threshold alerting on top (Microsoft Learn).
The same shape of capability exists on the other major clouds. Amazon CloudWatch collects metrics, logs (with CloudWatch Logs Insights for fast queries), and alarms, and its Application Signals feature auto-detects the latency, error-rate, and request-rate metrics for a service without manual instrumentation (AWS documentation). Google Cloud Observability (formerly Cloud Operations / Stackdriver) bundles monitoring, logging, tracing, and continuous profiling into one suite for the same purpose (Google Cloud documentation).
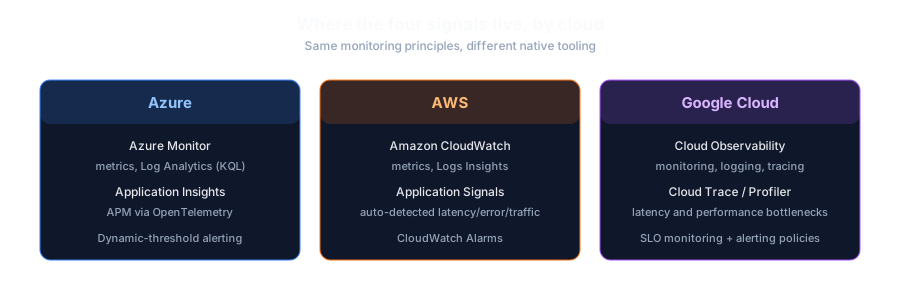
None of these tools implement burn-rate alerting for you automatically — that logic (the multiple windows, the page-versus-ticket thresholds) has to be configured deliberately on top of whichever platform you use, using each tool's own alerting rules engine.
Why It Matters
A well-run platform gives the organisation more confidence to change. Without that operational discipline, even a good architecture becomes hard to trust — teams become reluctant to deploy, incident response becomes reactive firefighting instead of a practiced process, and small, low-risk changes get bundled into infrequent, higher-risk release windows because nobody trusts the platform to absorb frequent small changes safely.
What to Optimise
Good operations is usually about reducing noise, increasing signal, and making ownership obvious. The point is to spend less time reacting and more time improving.
- Incident response and runbooks — a documented, practiced process for what happens when the golden signals indicate a problem, not an improvised response invented during the incident itself.
- Alert quality and observability — alerts that map to the four golden signals and a burn-rate-aware error budget, not an accumulation of every metric anyone has ever thought to threshold.
- Cost and capacity reviews — a recurring, not one-time, check that resource usage (including the saturation signal above) still matches actual demand.
Common Mistakes
- Alerting on every available metric instead of the signals that predict user impact. This is precisely the alert-fatigue failure mode that makes teams start ignoring pages — if most alerts don't correspond to something actionable, the team learns to treat all alerts as noise, including the ones that matter.
- Alerting on a raw SLO threshold instead of burn rate. As Google's own workbook demonstrates, this produces frequent alerts for events that barely dent the error budget, while slow chronic degradations can go unnoticed (Google SRE Workbook).
- Defining "errors" only as explicit failure codes. Google's own definition explicitly includes implicit failures (wrong content behind a success status) — an alerting setup that only checks status codes will miss this category entirely.
- Treating reliability as a permanent, non-negotiable maximum rather than a budget. Without an error budget framing, "how much risk can we take this release" becomes a recurring argument instead of a number both product and operations teams can reference.
- No practiced incident response process. A runbook that has never actually been exercised is a document, not a capability — the first real incident is the wrong time to discover it's outdated or incomplete.
- Capacity and cost reviews treated as a one-time setup task. Saturation and cost profiles shift as usage patterns change; a review done once at launch and never repeated stops reflecting reality within a few months.
Trade-offs and Decision Guidance
The service is customer-facing and reliability failures have direct business or safety consequences — the tighter budget forces more conservative release pacing when warranted.
Setting an SLO stricter than the business actually needs burns engineering time on marginal reliability gains instead of features — the SLO should reflect genuine user and business impact, not an arbitrary "higher is always better" instinct.
Cost, Complexity and Timeline
Instrumenting the four golden signals for an existing platform is moderate effort, mostly integration work across services that may not currently expose these metrics consistently — largely a matter of enabling the native tooling (Azure Monitor and Application Insights, CloudWatch, or Google Cloud Observability) consistently across every service rather than building custom collection. Establishing a genuine error budget process, including burn-rate alerting, is more of an organisational change than a technical one — the technical mechanics are straightforward to configure once the SLO is defined; the harder part is getting product and engineering leadership to actually honor the budget's implied release-pacing decisions rather than overriding it under deadline pressure. Ongoing operations — alert tuning, incident response practice, capacity/cost review — is a continuous cost, not a one-time project, and should be resourced as an ongoing function rather than treated as complete once initial monitoring is stood up.
How Halden Solutions Approaches This
We prioritise instrumenting the four golden signals correctly — including the often-missed implicit-error category — before adding additional bespoke metrics, since that gives the clearest baseline picture of platform health. On Azure environments, that typically starts with Azure Monitor and Application Insights configured consistently across every workload, rather than left to whichever defaults each service team happened to enable. Where a client doesn't yet have a formal error budget process, we help translate business reliability expectations into a concrete SLO and budget — including burn-rate-based alerting rather than a raw threshold — specifically to remove the recurring, subjective negotiation between feature velocity and operational caution. Runbooks and incident response processes are treated as capabilities to be practiced, not documents to be written once and filed away.
Frequently Asked Questions
What are the "four golden signals" in monitoring? Latency, traffic, errors, and saturation, as defined in Google's SRE book — chosen as the minimum set that gives comprehensive coverage of a user-facing system's health if you can only track a small number of metrics.
What is an error budget? The inverse of a service level objective — if your SLO requires 99.99% success, your error budget is the remaining 0.01% of allowable failure for that period. It's used to make reliability-versus-velocity trade-offs an explicit, shared number instead of an ongoing argument.
Why not just alert whenever the error rate exceeds the SLO? Because that rule is a poor predictor of actual budget risk. Google's SRE Workbook shows it can trigger frequent alerts for brief spikes that consume very little of the error budget, while missing slow, chronic degradations that quietly consume a lot of it. Burn-rate alerting, confirmed across multiple time windows, is the recommended alternative.
Do we need different monitoring approaches on Azure vs. AWS vs. Google Cloud? No — the four-signals and error-budget model is provider-agnostic. What differs is the native tooling: Azure Monitor and Application Insights on Azure, Amazon CloudWatch on AWS, and Google Cloud Observability on Google Cloud. Burn-rate alerting logic has to be configured on top of whichever platform you use.
Is a stricter SLO always better? No — an unnecessarily strict SLO consumes engineering effort on reliability gains beyond what users or the business actually need, at the direct cost of feature development time. The right SLO reflects genuine impact, not a default preference for the highest number achievable.
Conclusion
Operating a cloud platform well is a continuous engineering discipline, not a state you reach once and maintain automatically. Monitoring the four golden signals, using a burn-rate-aware error budget to make reliability trade-offs explicit rather than political, and treating incident response and capacity review as ongoing practices rather than one-time setup tasks are what separate a platform the organisation trusts to change quickly from one everyone is afraid to touch.
If your platform's operational discipline hasn't kept pace with its growth, Halden Solutions' Managed Operations team can help assess where monitoring, alerting, and incident response need attention.